
| Strategy 2 | Strategy 1 | |
| Profitability | ||
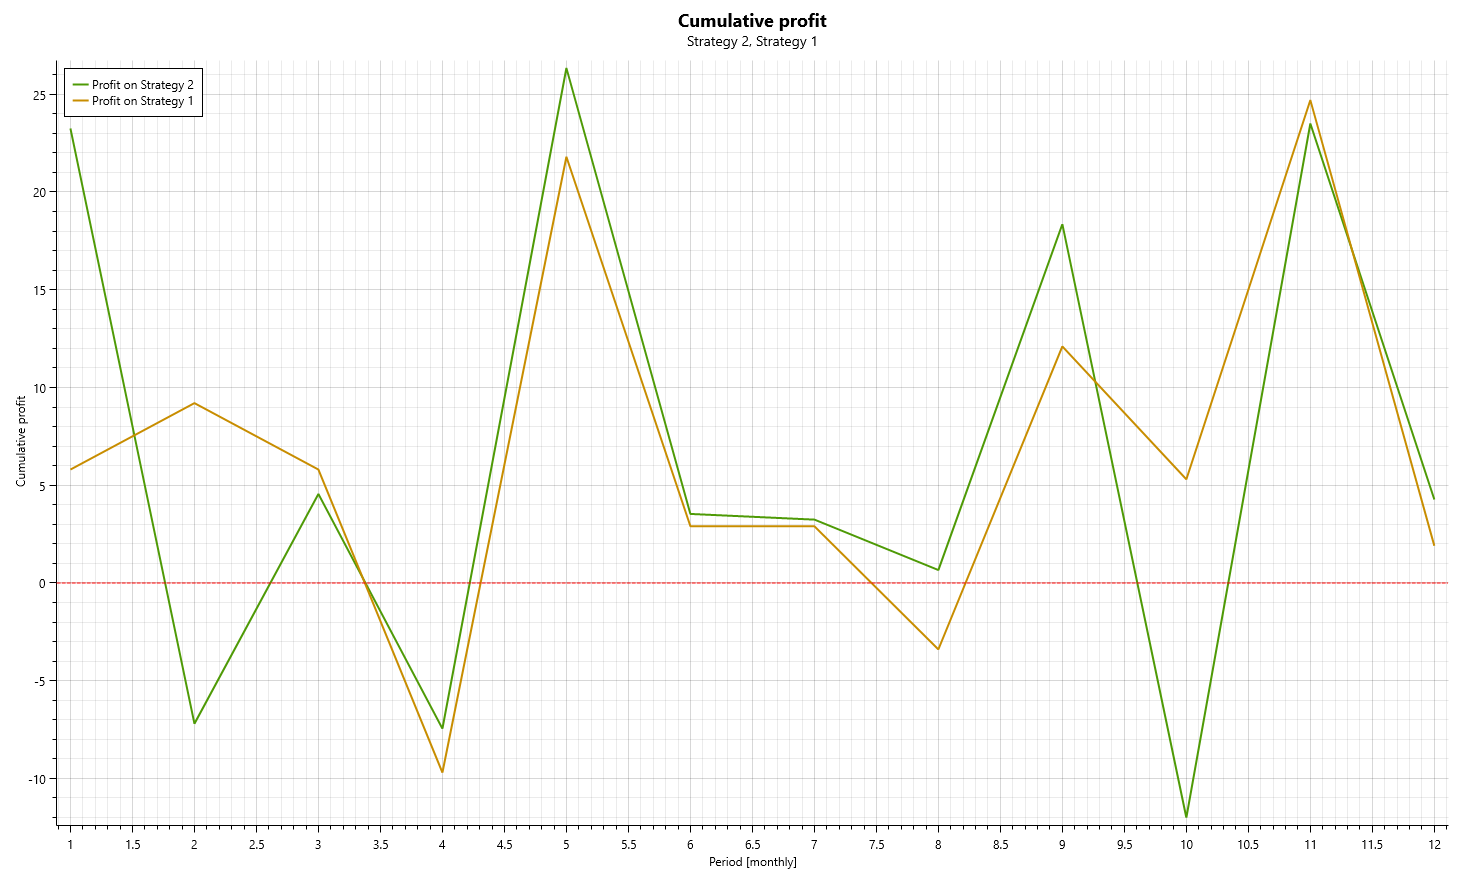
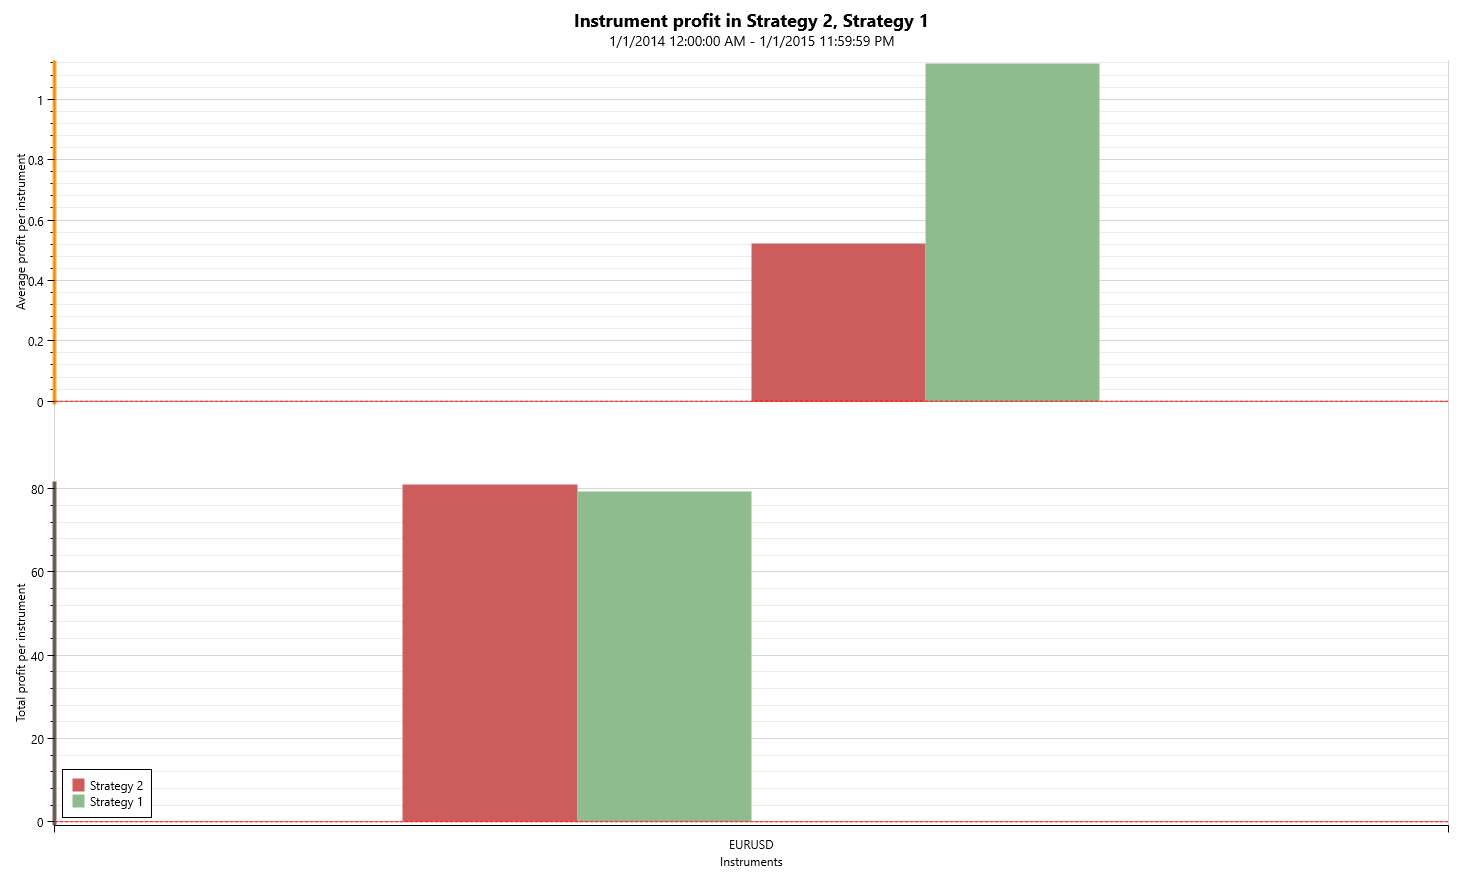
| Net profit | 81.04 | 79.30 |
| Net profit(% of deposits) | 0.00 | 0.00 |
| Max profit | 7.93 | 6.30 |
| Max loss | -12.08 | -9.70 |
| Gross profit | 449.07 | 302.40 |
| Gross loss | -368.03 | -223.10 |
| Relative profit (% of prev. balance) | 0.00 | 0.00 |
| Average | ||
| Average per trade | 0.52 | 1.12 |
| Average loss | -5.41 | -9.70 |
| Average profit | 5.16 | 6.30 |
| Trades count | 155 | 71 |
| Average cons. wins | 1.93 | 2.82 |
| Average cons. losses | 1.55 | 1.44 |
| Profitable trades count | 87 | 48 |
| Profit trades (%) | 56.13 | 67.61 |
| Lost trades count | 68 | 23 |
| Lost trades(%) | 43.87 | 32.39 |
| Long positions | 69 | 34 |
| Short positions | 86 | 37 |
| Long pos. won | 33 | 20 |
| Short pos. won | 54 | 28 |
| Long pos. won(%) | 47.83 | 58.82 |
| Short pos. won(%) | 62.79 | 75.68 |
| Performance | ||
| Effectivity | 9.92 | 15.09 |
| Profit/avg.loss | 14.97 | 8.18 |
| Profit/drawdown | 1.46 | 2.73 |
| Flows | ||
| Deposits | 0.00 | 0.00 |
| Withdrawals | 0.00 | 0.00 |
| Other operations | 0.00 | 0.00 |
| Money flow | 817.10 | 525.50 |
| Series | ||
| Longest win. streak | 6 | 6 |
| Longest win. streak profit | 30.87 | 37.80 |
| Consecutive losses | 4 | 3 |
| Consecutive losses sum | -27.04 | -29.10 |
| Max. consecutive profit | 6 | 6 |
| Max. consecutive profit sum | 30.87 | 37.80 |
| Longest loosing streak | 4 | 3 |
| Longest loos. streak sum | -34.12 | -29.10 |
| Absolute drawdown | 55.51 | 29.10 |
| Relative drawdown(%) | 77.17 | 76.98 |