 |
Stats progress |
The free version of QuantSense is computing the data for charts on a per trade basis. Altough it is usually sufficient to see the current values of the statistics (with respect to the last trade from the trade set selected in the Trade navigator) it is much better to see how statistics evolve over the time. Moreover, this upgrade allows you to display any combination of statistics computed by QuantSense in one chart in any time granularity (daily, weekly, monthly, quarterly, yearly). You can even ask QuantSense to compute every statistic for every 'n' trades if the time granularity is not for you.
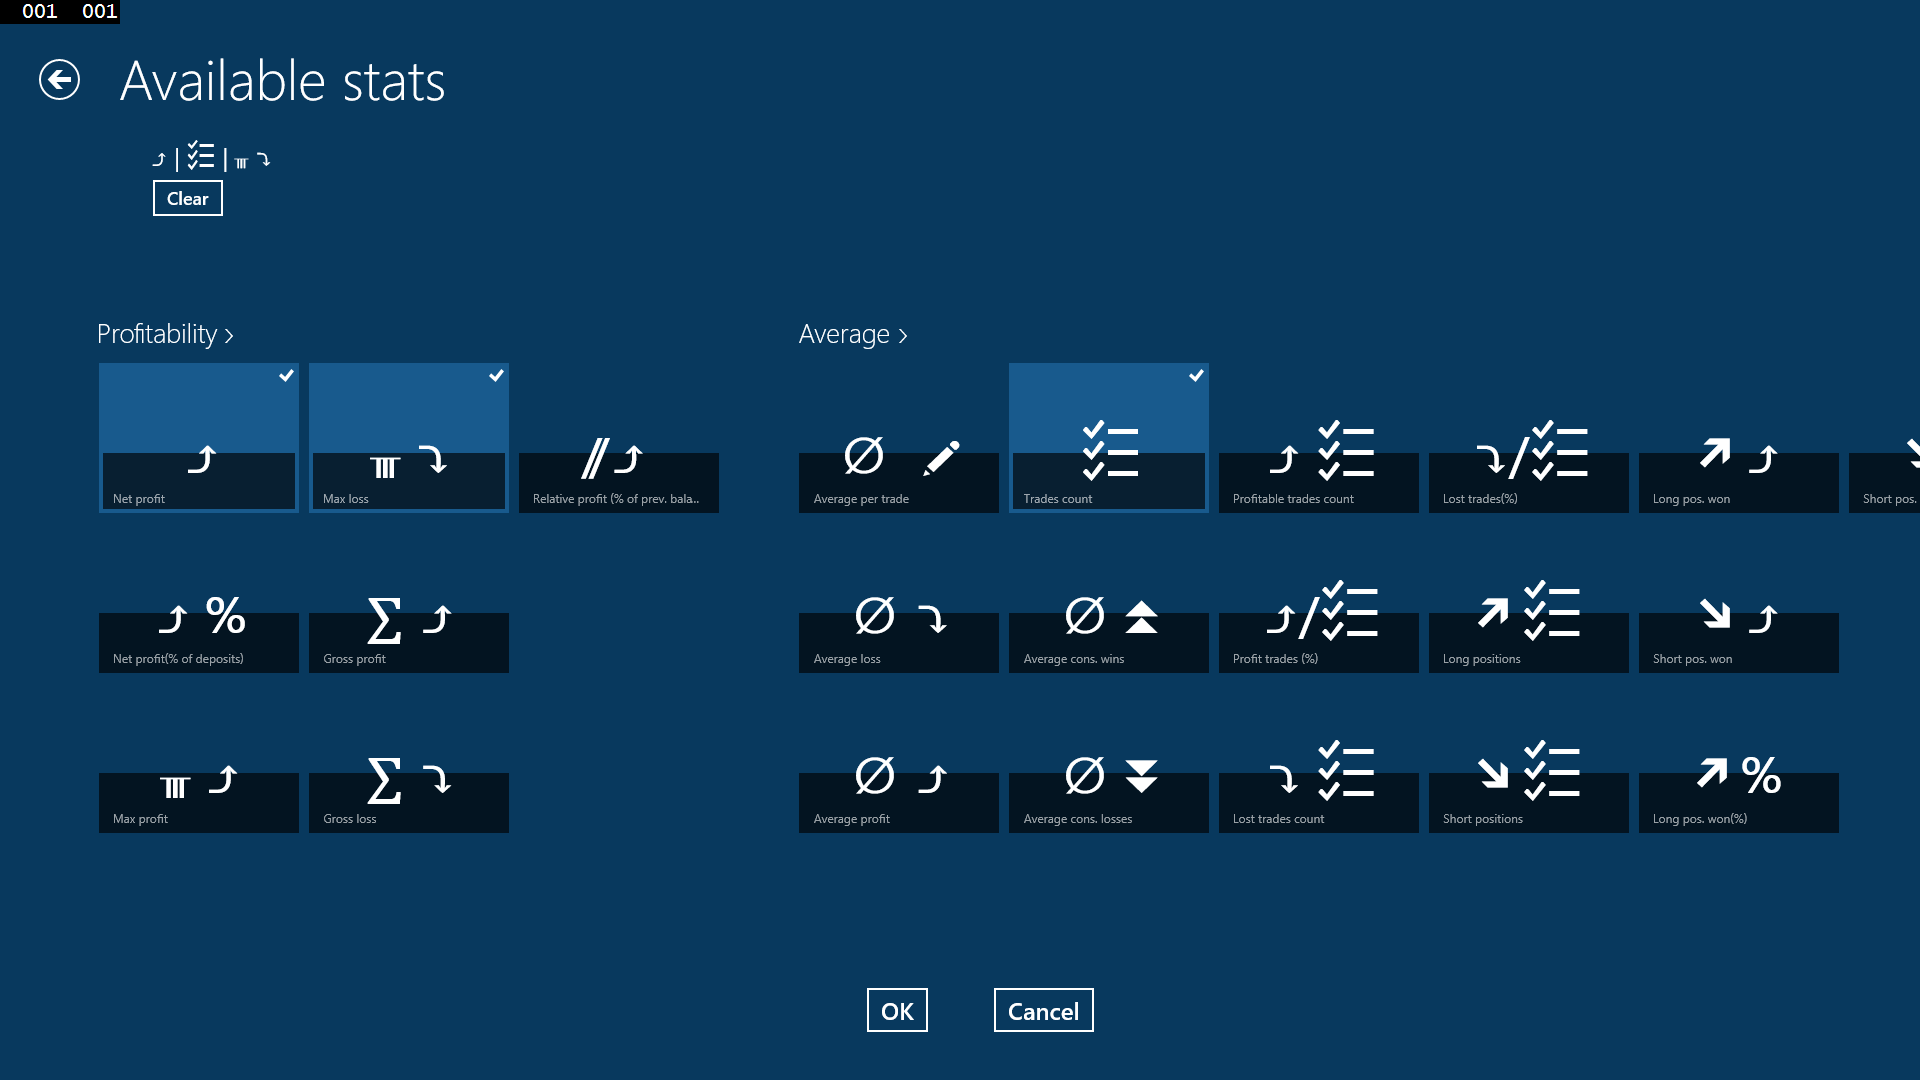
In the main menu click the Analysis button. Analysis page will appear. Click the first button and from the drop down menu select "Stats progress". Click the second button and set desired granularity for the computation. There is one special option "n-trades" which will compute one value of statistic(s) for every set of "n" trades. Select one or more statistics from Available stats screen:
After clicking "OK" you will get back to Analysis page and a similar chart will be displayed:
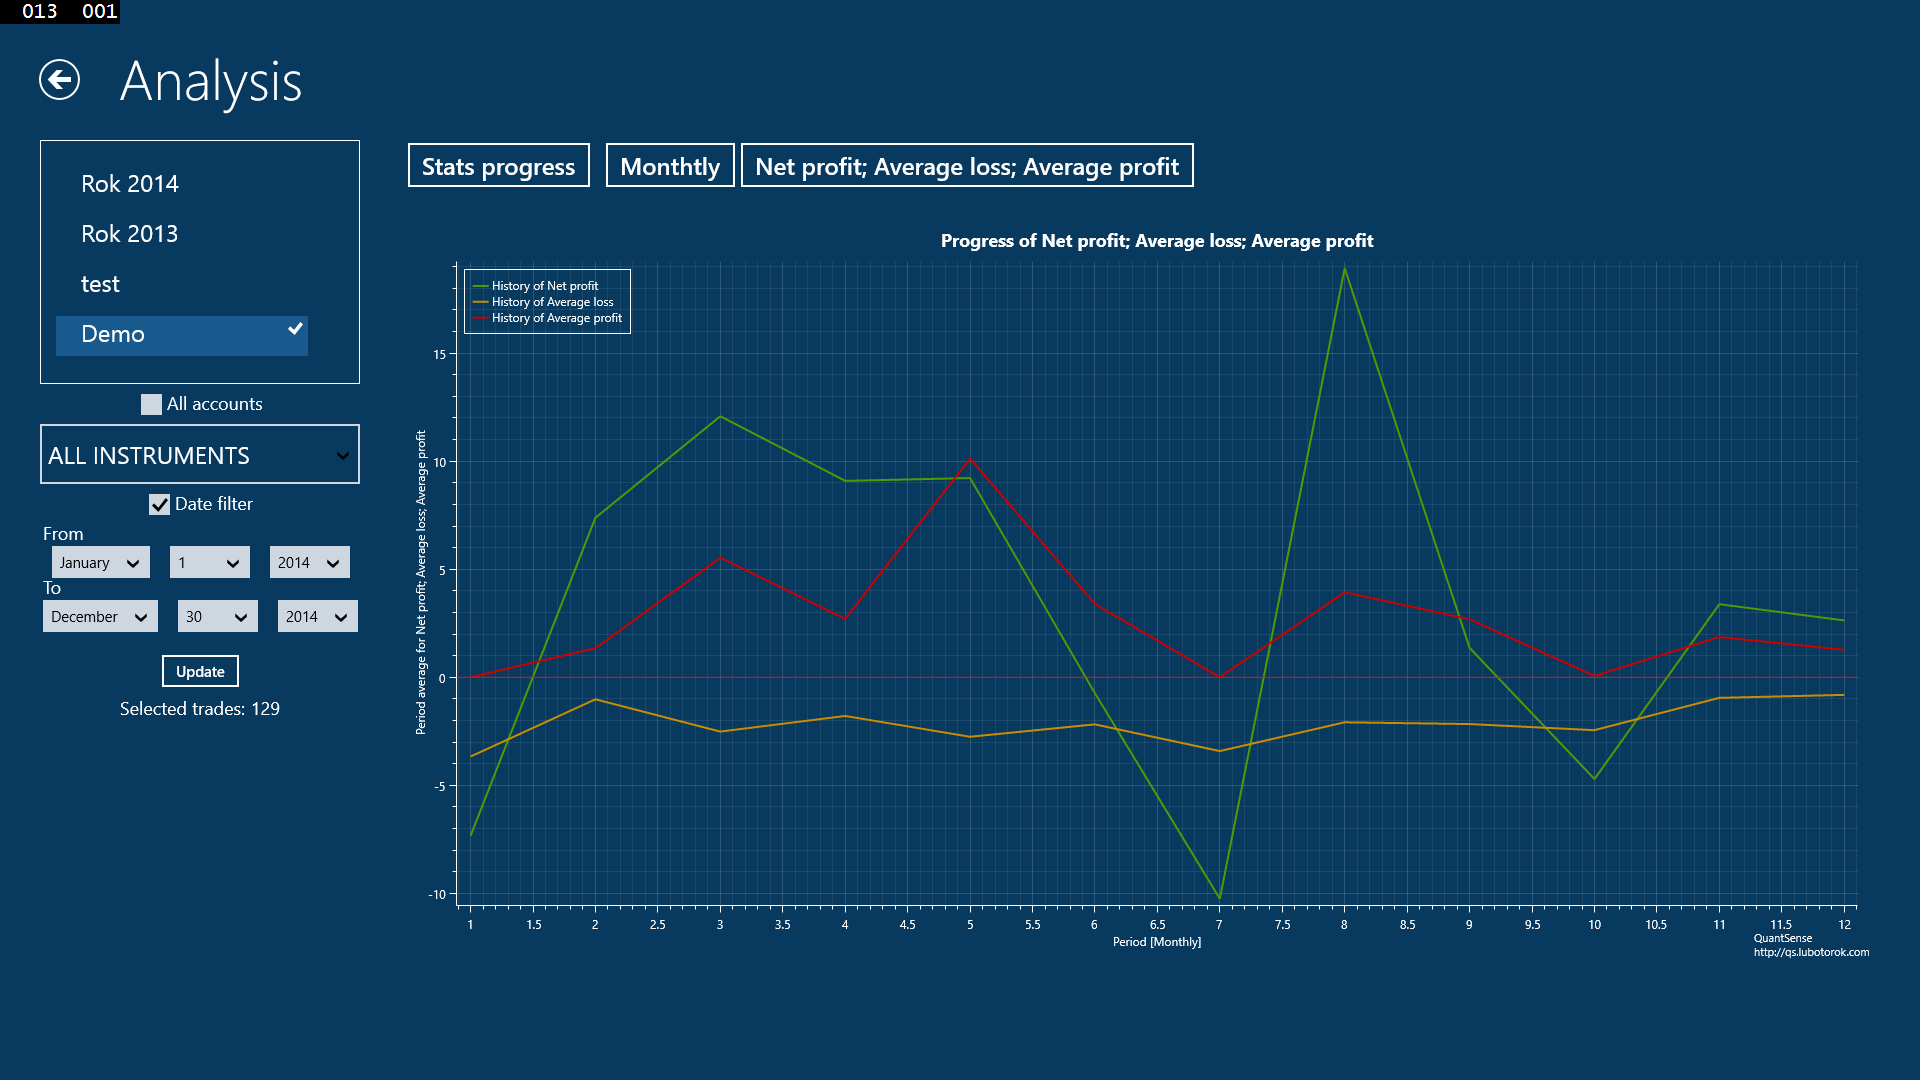
In the image the Net profit (green), Average loss(yellow) and Average profit(red) statistics are displayed in the chart. All of them computed monthly (x-axis) on trades from "Demo" account closed between January 1 2014 and December 30 2014. Trades on ALL INSTRUMENTS are included in the trade set used for the computation of the values in the chart. You can change the granularity of the computation and the input trade set in the Trade navigator and the chart will act accordingly.