QuantSense |
Trading diary and analyzing tool for traders
Windows 10QuantSense 2.3
After some time I have added support for Meta Trader 5 reports import. QuantSense supports data export in .csv format. Now the files of this type can be imported as well. You can use it to import data from other sources provided you can format it in this structure.QuantSense is an advanced tool for recording trade history, statistical analysis of trades and optimizing trading strategies. For this purpose it provides highly sophisticated tools including quantitative analysis and data mining.
The app is free and without any ads. Advanced features or upgrades can be purchased inside the app. The basic version is not limited in any way - all features it has are fully implemented. Detailed description of current and future upgrades can be found here.
Main features (free):
data import
- MetaTrader 4 trade history import Import your trade history from MetaTrader 4 easily. Trade history, account operations and traded instruments are imported from your MT4 trading report. You can import all your trading history into QuantSense in one click.
- MetaTrader 4 strategy tester results import As of version 1.2.0 you can import the results of a simulation from MetaTrader's strategy tester. Run a test of your strategy in MT4 strategy tester and save the results as a report. You can import this file into QuantSense for further analysis and optimization of your strategy.
- MetaTrader 5 trade history import Added in version 2.3. Works similar as with MetaTrader 4.
- MetaTrader 5 strategy tester result import Added in version 2.3. Works similar as with MetaTrader 4.
- QuantSense .csv import Added in version 2.3. Supports import of .csv file in the following structure (list of columns is in requested order): Ticket, Instrument, Open date, Close date, Volume, Type, Open price, Close price, Max. value, Min. value, Commision, Taxes, Swap, Profit, Import, Min. profit, Max. profit, Notes, Stop loss history, Take profit history.
Example .csv file: Download
set of trades selection
Input for any algorithm or statistic is a set of your trades. This set can be defined by Trade navigation panel in the following ways. You can- select one or more accounts and
- select an instrument and
- filter the set of trades by
- a date interval
- trade type (long or short)
- note text or its part
basic statistics
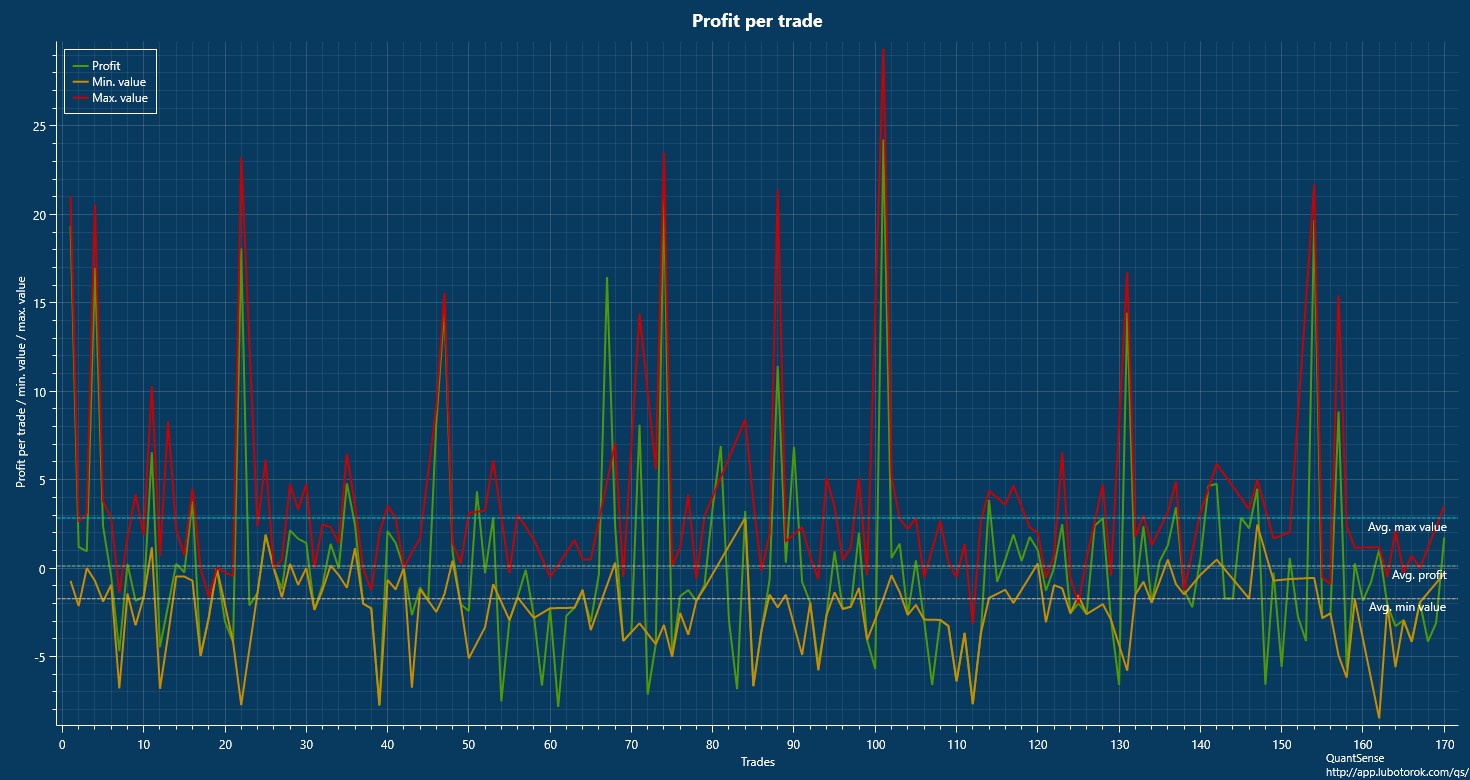
Even the basic version can compute and display some important statistics of your trading:- trade profit sequence together with maximal and minimal value of the position
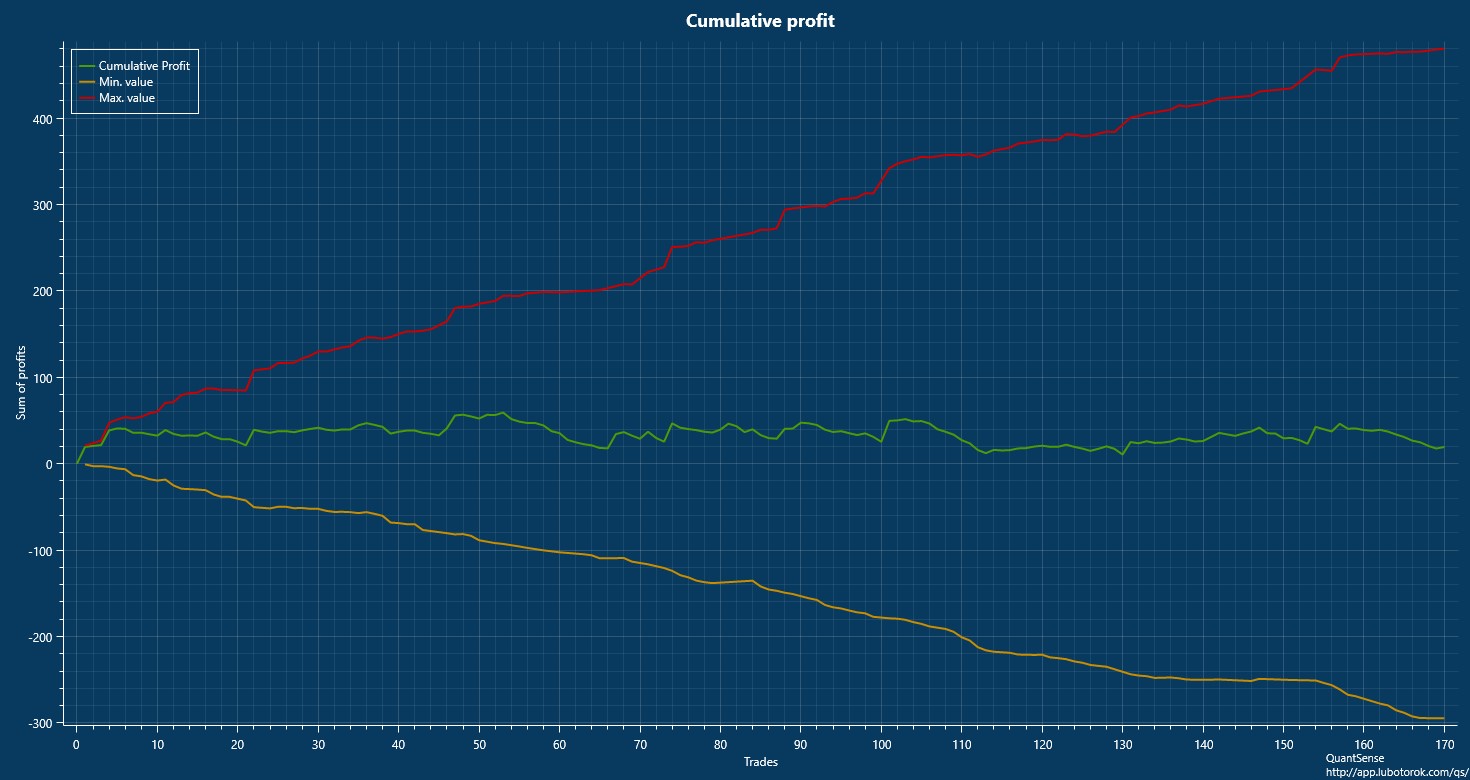
- cumulative profit together with cumulative maximum and minimum of your positions
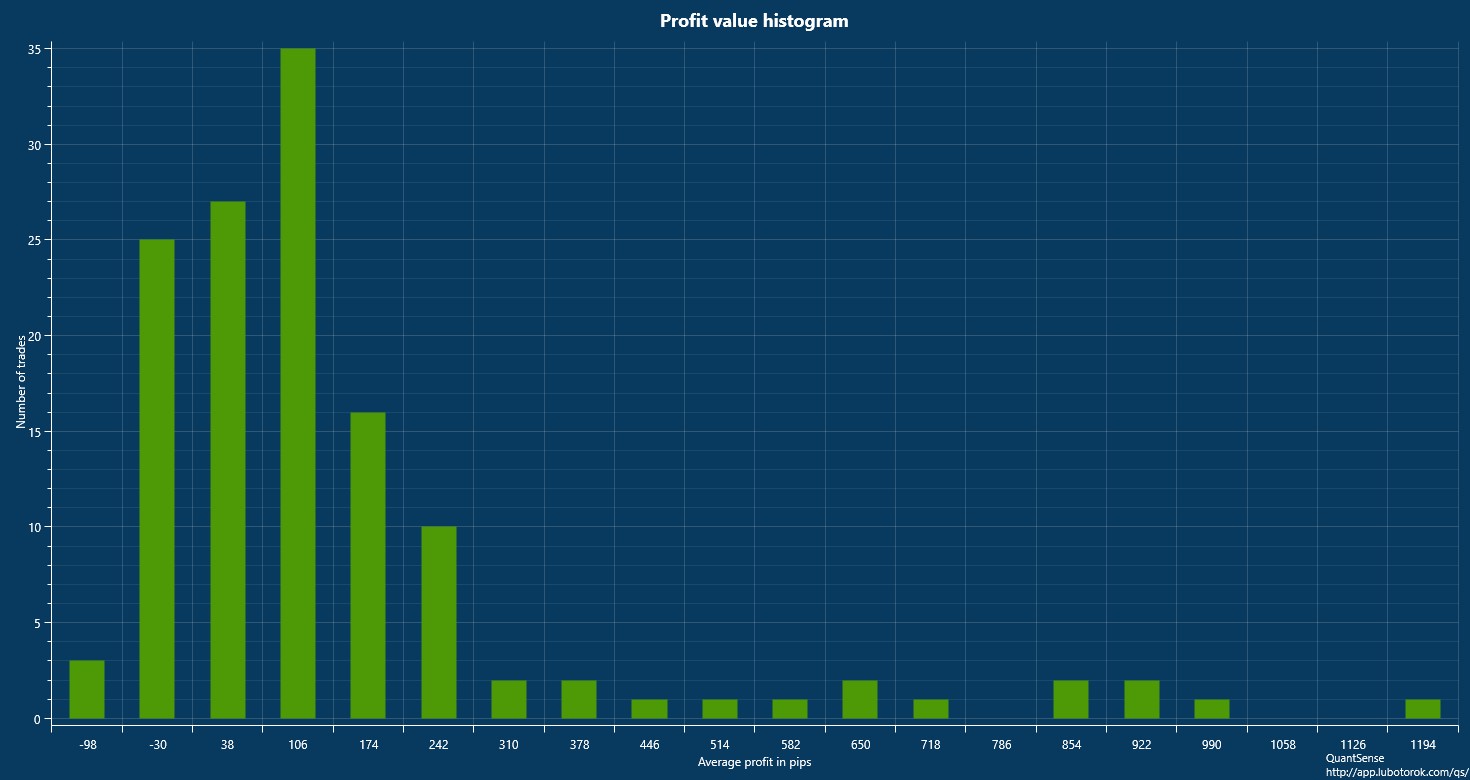
- a histogram showing maximal profit in pips so you can easily see
the distribution of maximal values of your positions.
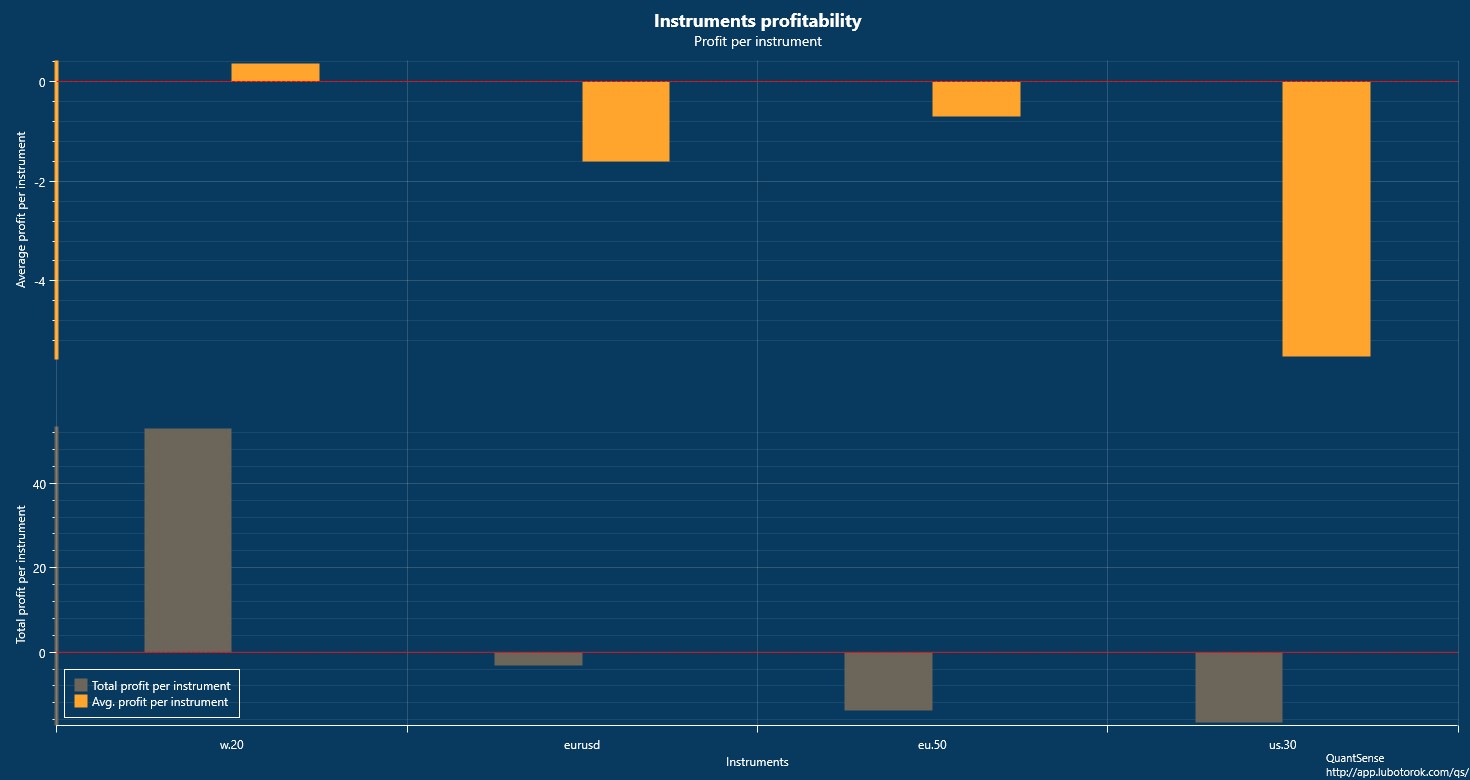
- instrument total and average profitability
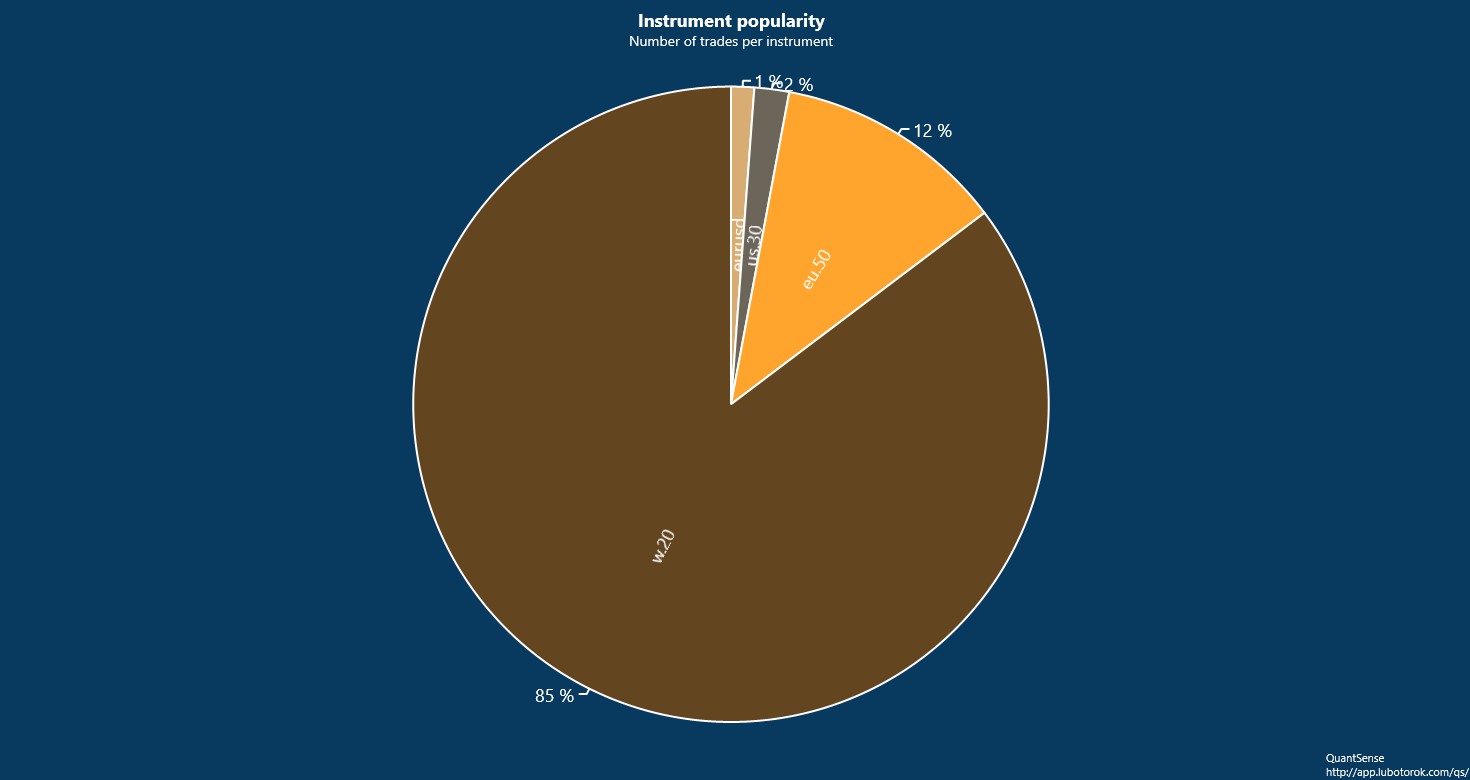
- instrument popularity
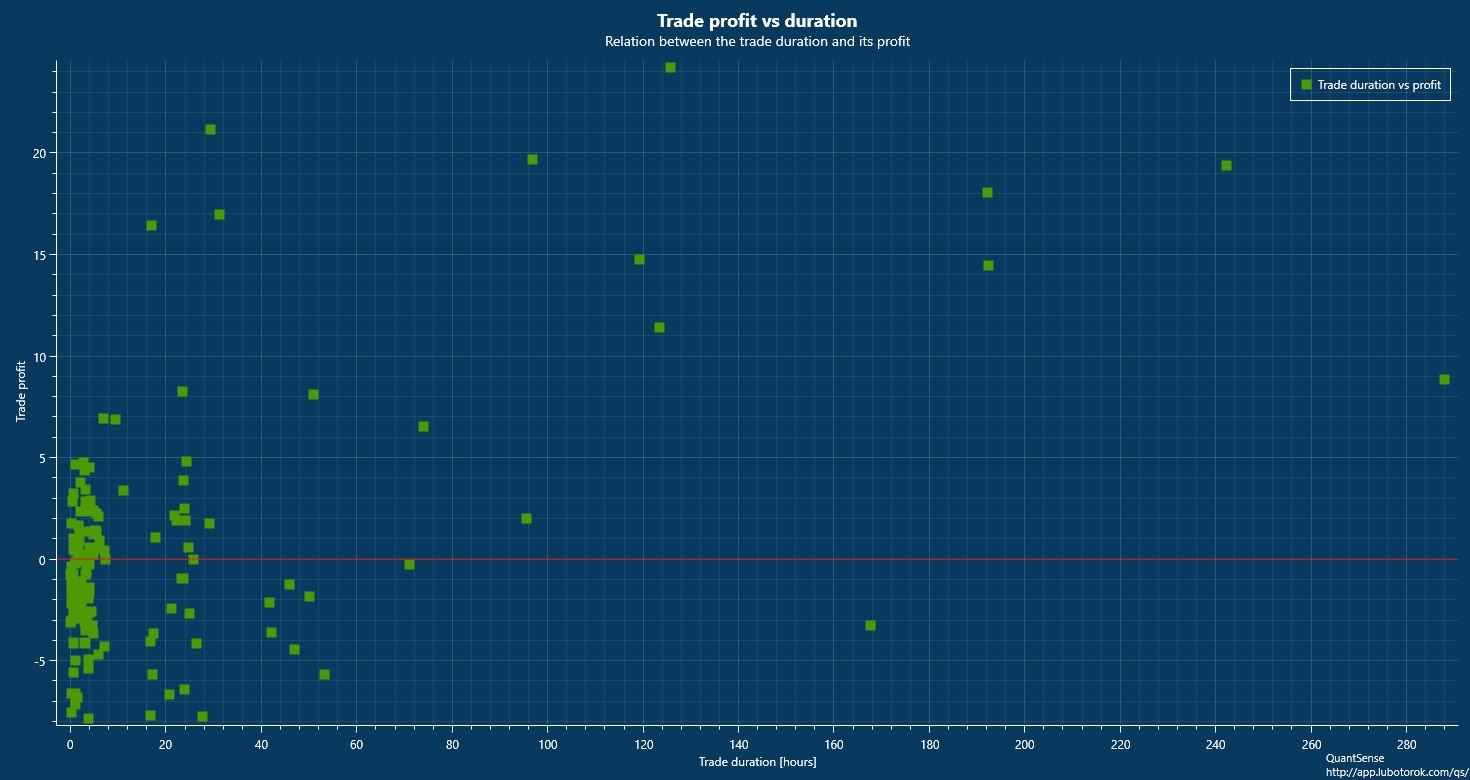
- a relation between the trade profit and the trade duration
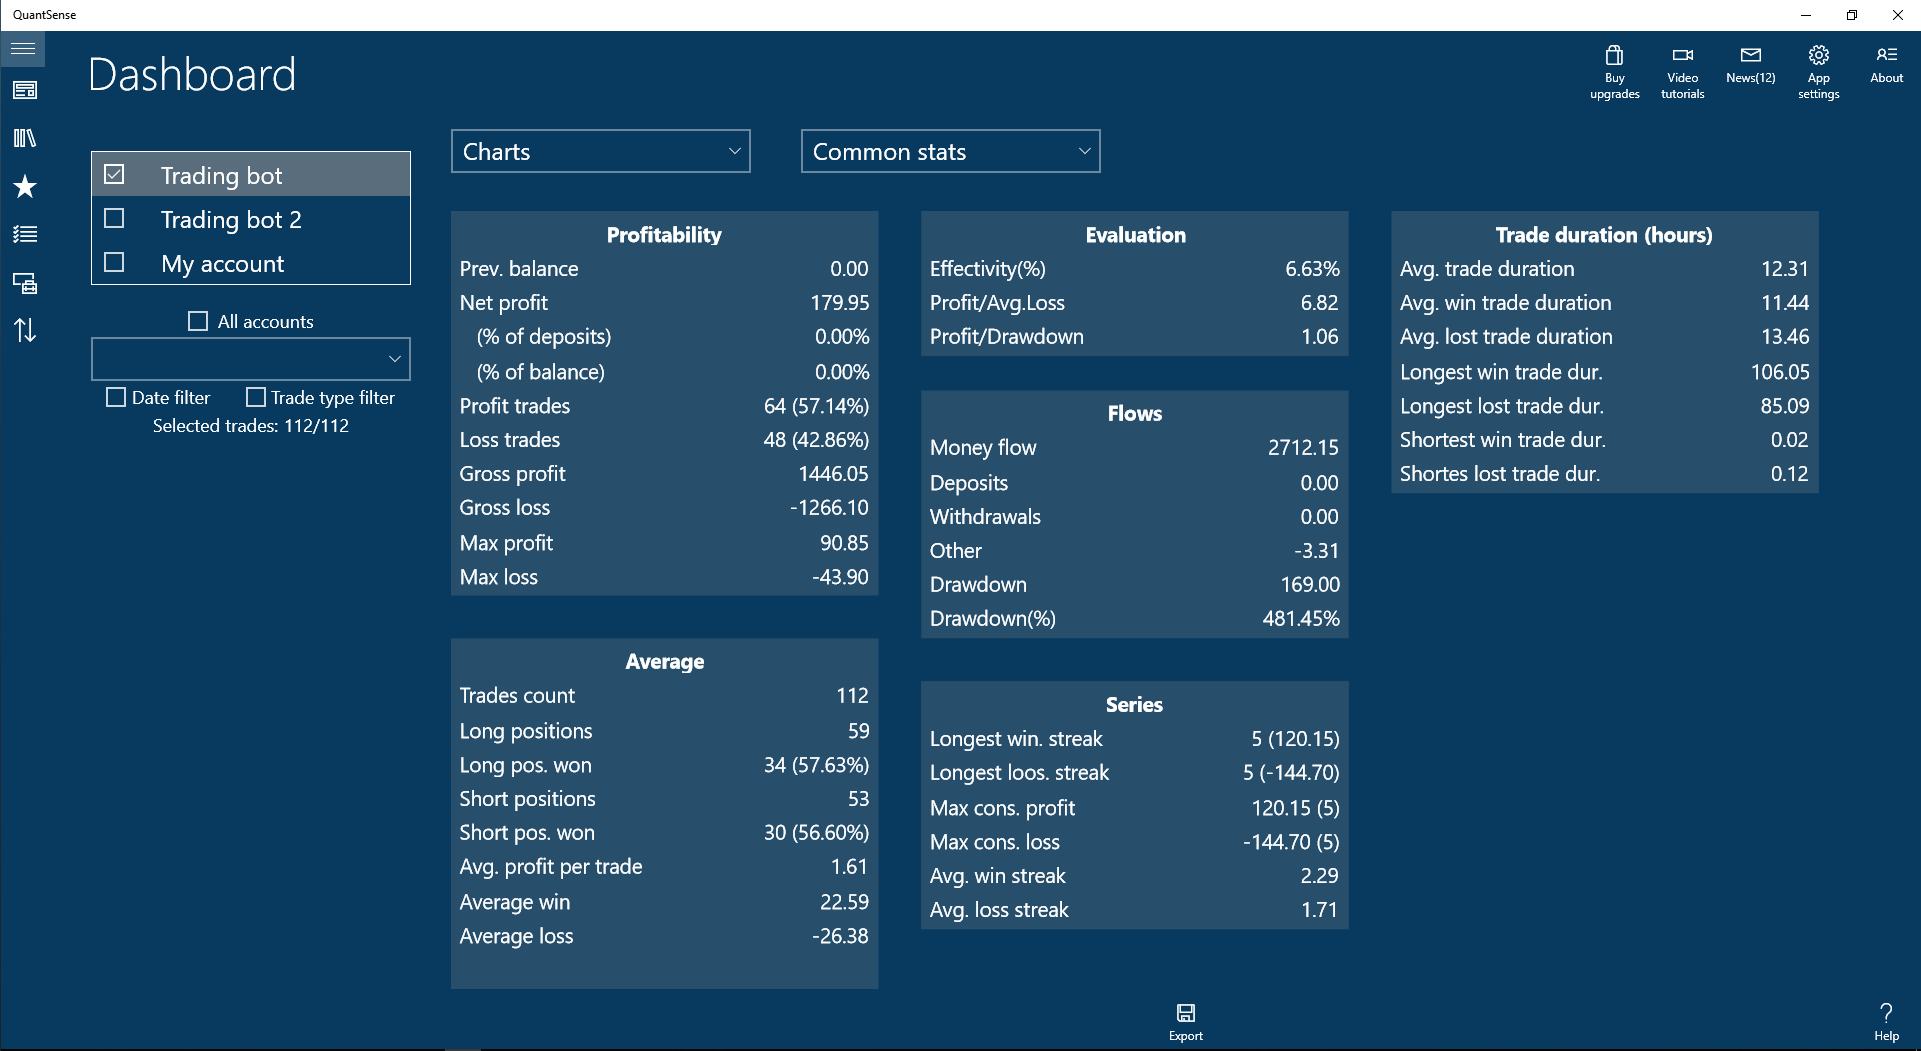
- ... and numerical statistics concerning profits, win/loss streaks, account transactions,
averages and others
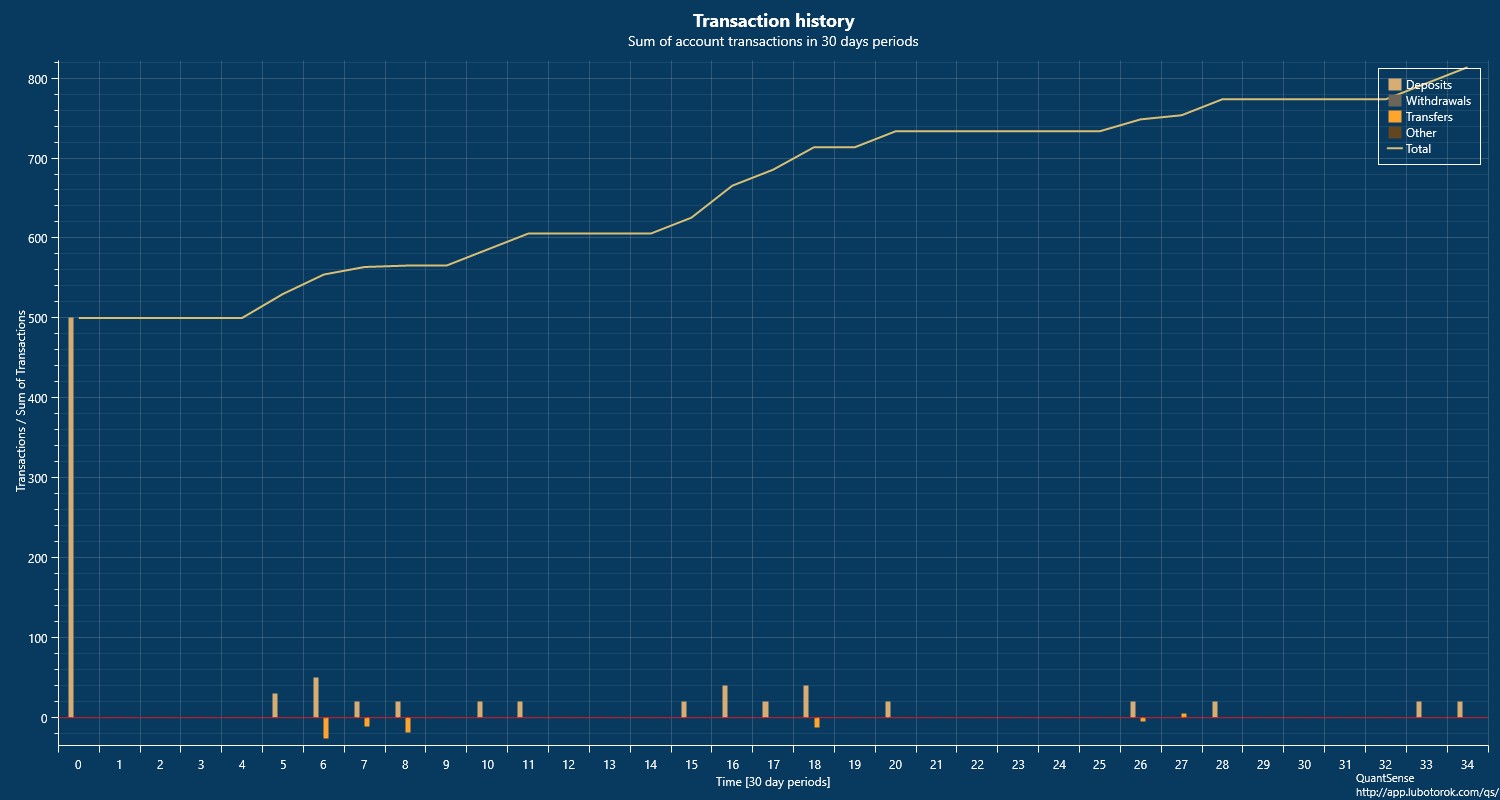
account transactions overview
- See the history of your account transactions: deposits, withdrawals,
transfers and others. Adding, deleting and editing of transactions is implemented.
Three different views are at your disposition: list, table with statistics or a chart
with transaction history and a curve showing sum of your deposits over time.
sharing
All charts and tables computed by QuantSense can be easily exported to file, sent via email or shared on social networks (provided you have a suitable app installed, Facebook app for sharing in Facebook for example).'stop loss' and 'take profit' history, trade notes
You can manually enter every change in SL and TP you made in a given trade so that you have a complete history of your decisions for a future reference. You can add as many notes to a trade as you need as well.privacy and data protection
Your data is stored locally. No third party cloud or server is involved. It connects to the QuantSense web site only for reading the QuantSense's news feed (three day period, connects during the app startup) and for reading its help files. An anonymous debug data is sent to its website too, but this can be turned off when owning the premium upgrade.Upgrades
You can upgrade your app by purchasing special features directly in the app. The features are packed into Upgrades such that an upgrade contains one or more features depending on their context. A web version of the QuantSense store is here. The web version of the store contains current and the coming upgrades for the app. The following is the list of features which are currently in the store or are in development and will appear in QuantSense store in the near future.
multiple accounts (available since v1.2.0)
Organise your trades into multiple accounts. All stats and algorithms can run on one or more selected accounts (the result is union of trades from selected accounts). Copy or move your trades between accounts so that you can analyse your trades, trades of your colleagues and trades of your automatic systems separately or together in any combination according to your preferences.stats progress chart (available since v1.3.0)
For any combination of statistics computed by QuantSense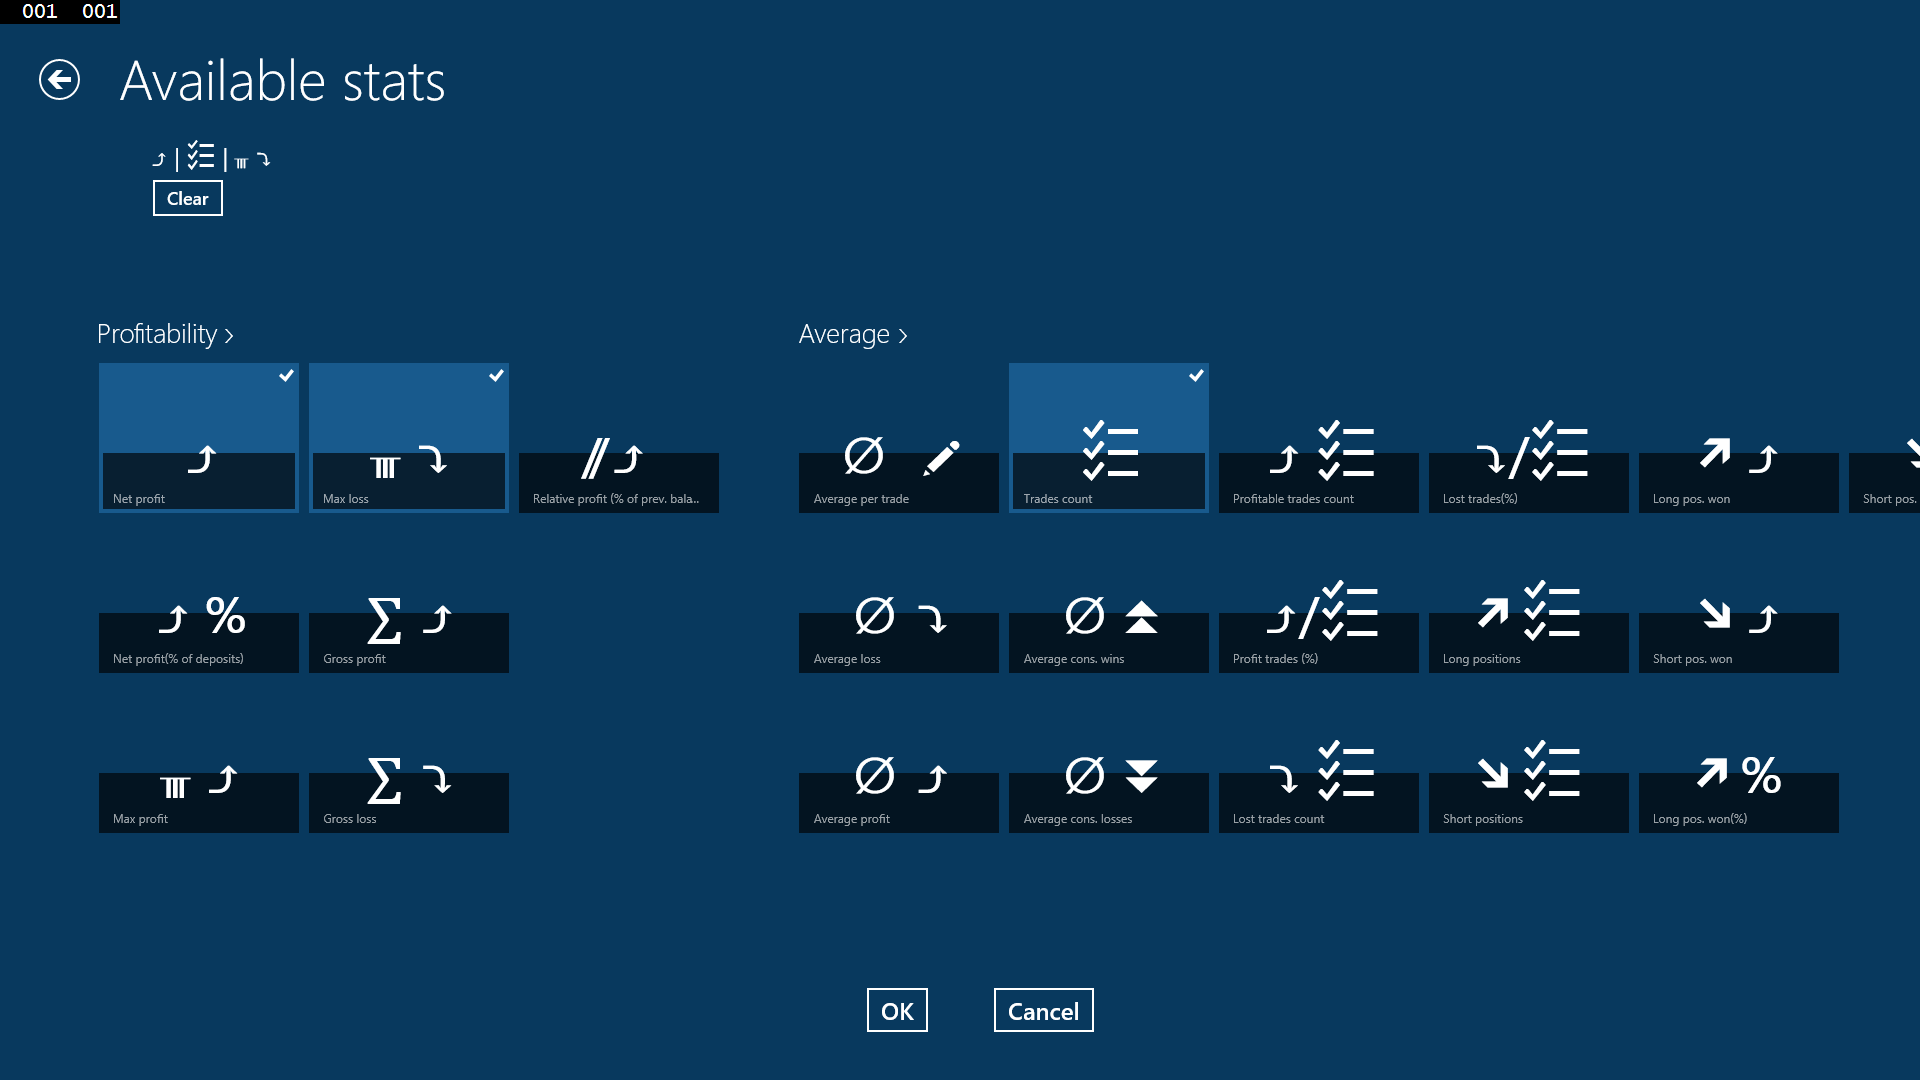
you can pick any period of time and QuantSense will show you how this statistics changed over the time. For example you need a few clicks to check the correlation between net profit, average loss and average profit computed monthly(daily, weekly, ... or in constant number of trades).
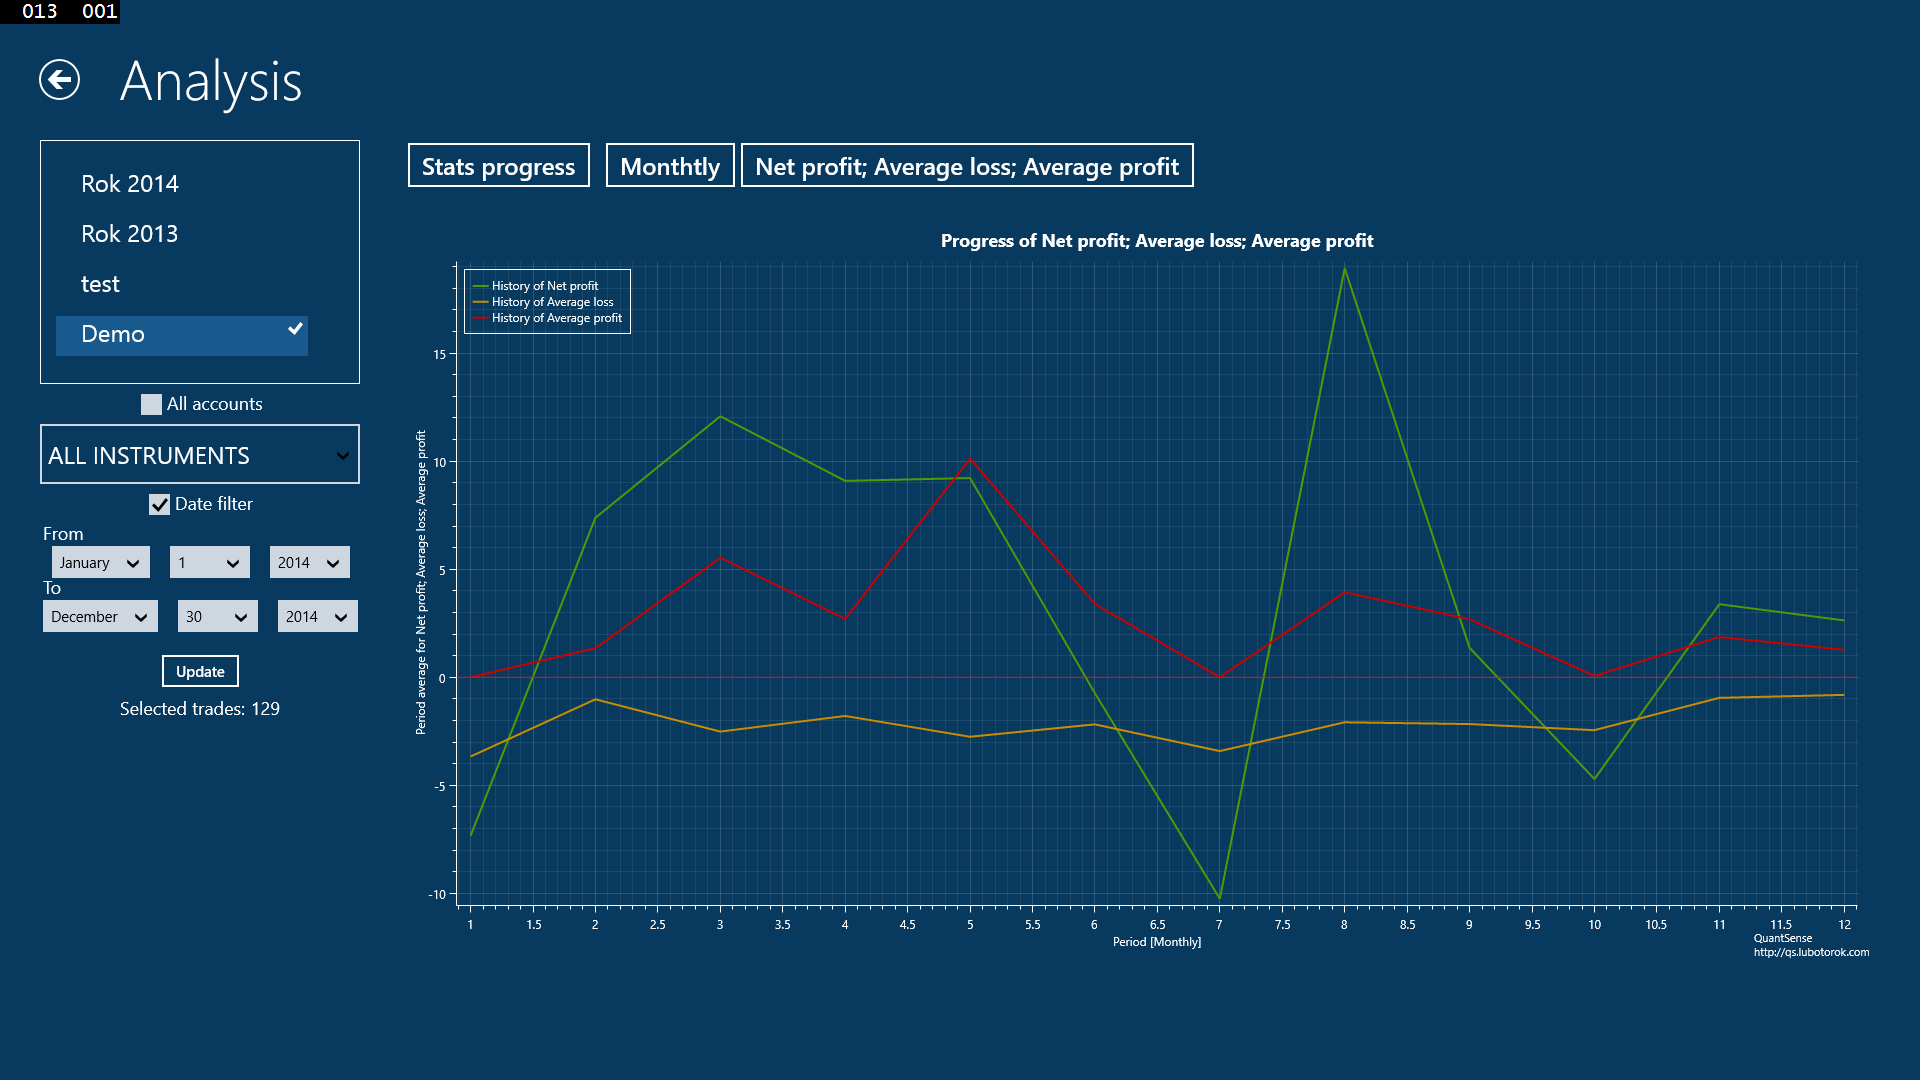
This upgrade allows you to see any correlations between any of your trading parameters, check the effect of their changes and optimize your future decisions.
reports (available since v1.4.0)
QuantSense now supports generating nice looking reports with user selected design and various options customizing the report content. Reports are created in html format and their contents can be viewed in the app or uploaded to a web site. The main features of this upgrade are the possibility to hide your absolute profits and to generate a report wich compares results on all QuantSense accounts selected by you. More details are here.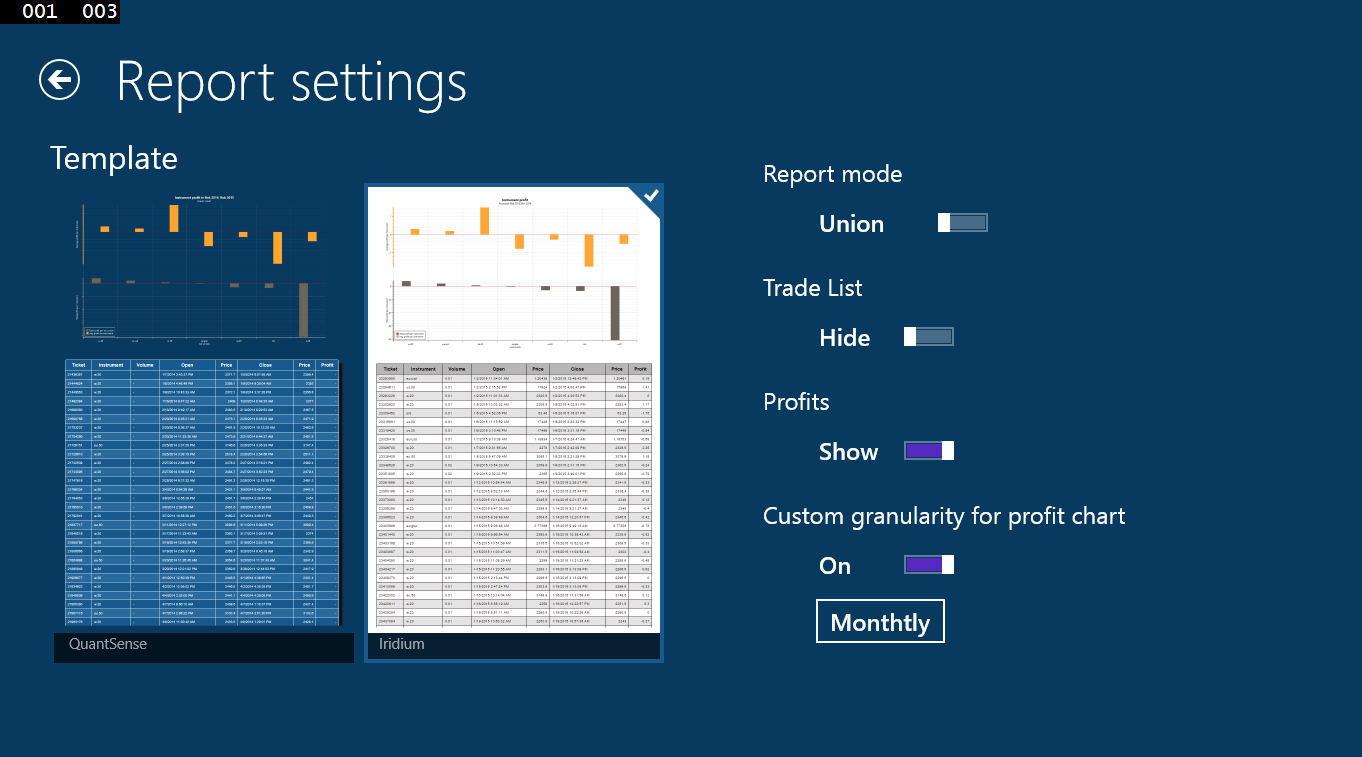
premium (Available since v1.4.0)
This pack is providing you all the current and the future upgrades of the app. Pay once and use all I will ever implement for QuantSense. The price will go higher with every upgrade I will add to the app so the sooner you invest the better for you. And thank you for supporting my work.min/max approximation (Since v1.5.1 for Premium)
Minimal and maximal vlaues of your trades are computed automatically based on the imported quotes. No need to enter them maually as in base version of the app.advanced data import (Available partially since v1.5.1 as beta test for Premium)
Import market quotes; any time frame for any instrument. Using this data the app can analyse your trades with respect to price development in provided time series even before and after your position was opened or closed, respectively. As a result QuantSense can provide you with an evaluation of your trade timing, stop loss and take profit settings.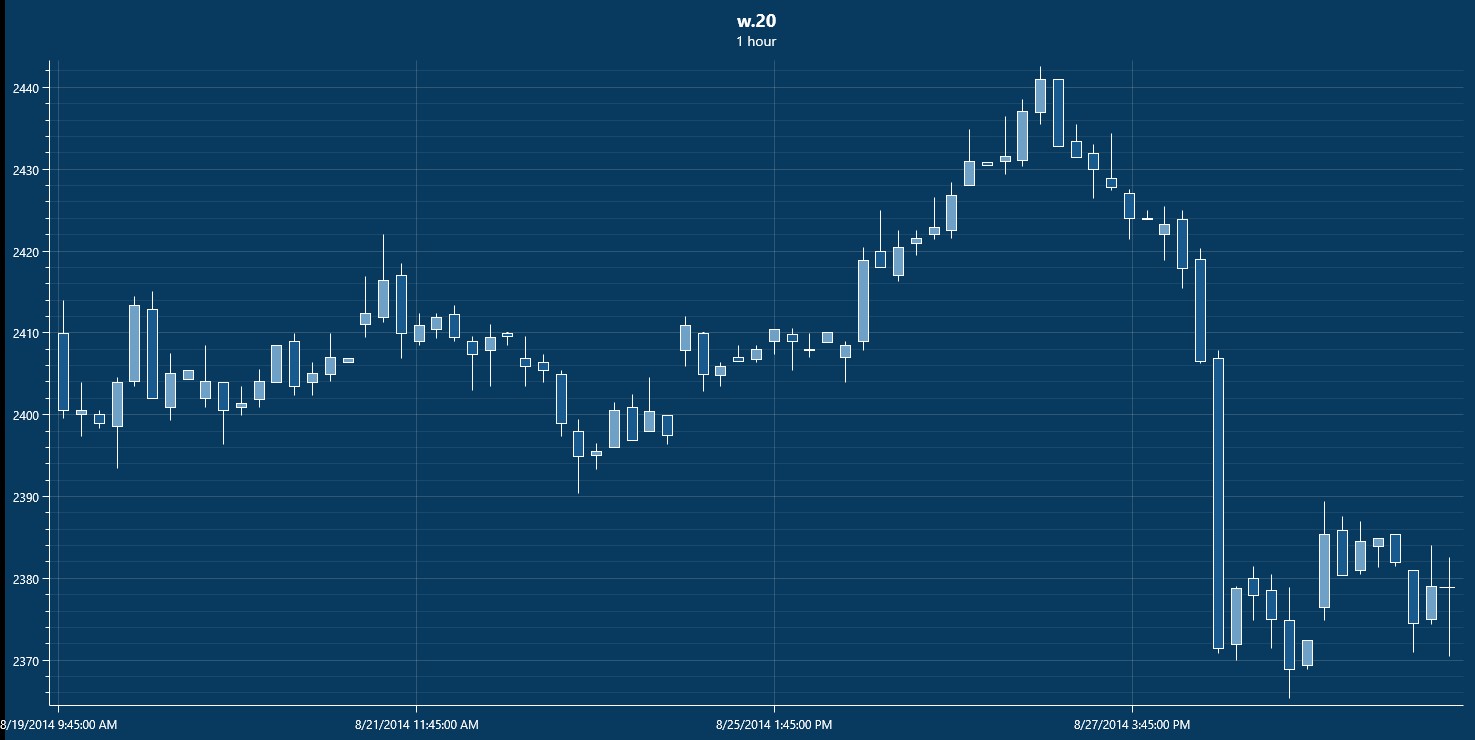
optimisation tools (since 1.6.1 for Premium)
As of version 1.6.1 you can use QuantSense to see how would your trade results look like with an alternative settings of Stop Loss, Take Profit and Volume. Simply select a set of trades and set the values of SL, TP and Volume. QuantSense will go through the selected trades and using the appropriate and the most precise market quotes it will simulate your trading with entered parameters so that you can see how would finish your own trading or strategy with an alternative settings of these parameters. The result is a chart with two profit curves - one for the original results and one for the simulated ones. Moreover, by clicking the 'Save' button you can save the simulated trades into a new account and use the full power of QuantSense to compare it with another trades or accounts, generate a report from it or anything else as with any other account in your database. This is a screen with this tool showing the results of a simulation: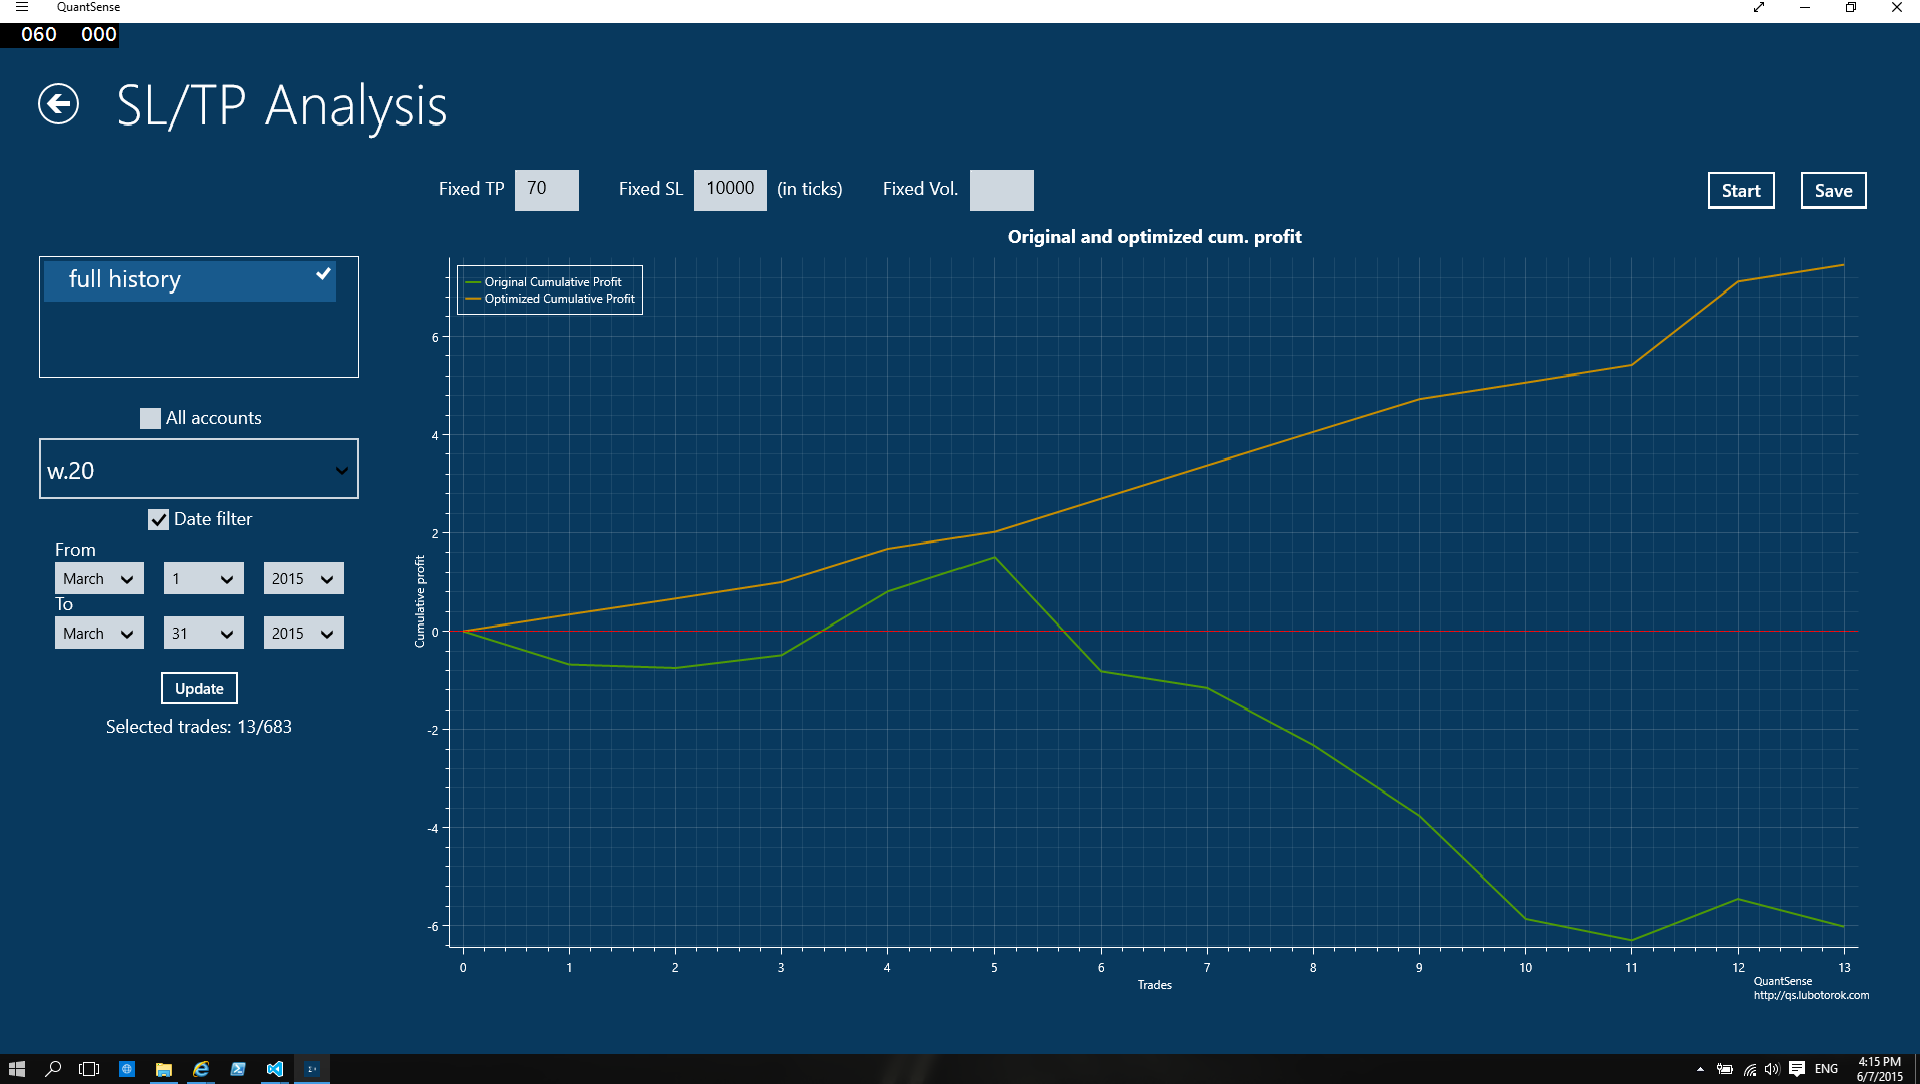
benchmarking (since 1.7.1 for Premium)
Use any market as a benchmark for your trades. Can you beat Dow Jones? Import its daily (or any other smaller) quotes for longer period of time and see relative comparison of your trading and Dow Jones. Only a few traders can systematically beat the indices. Try to be one of them. (Of course, you can use any market you have quotes for as a benchmark.)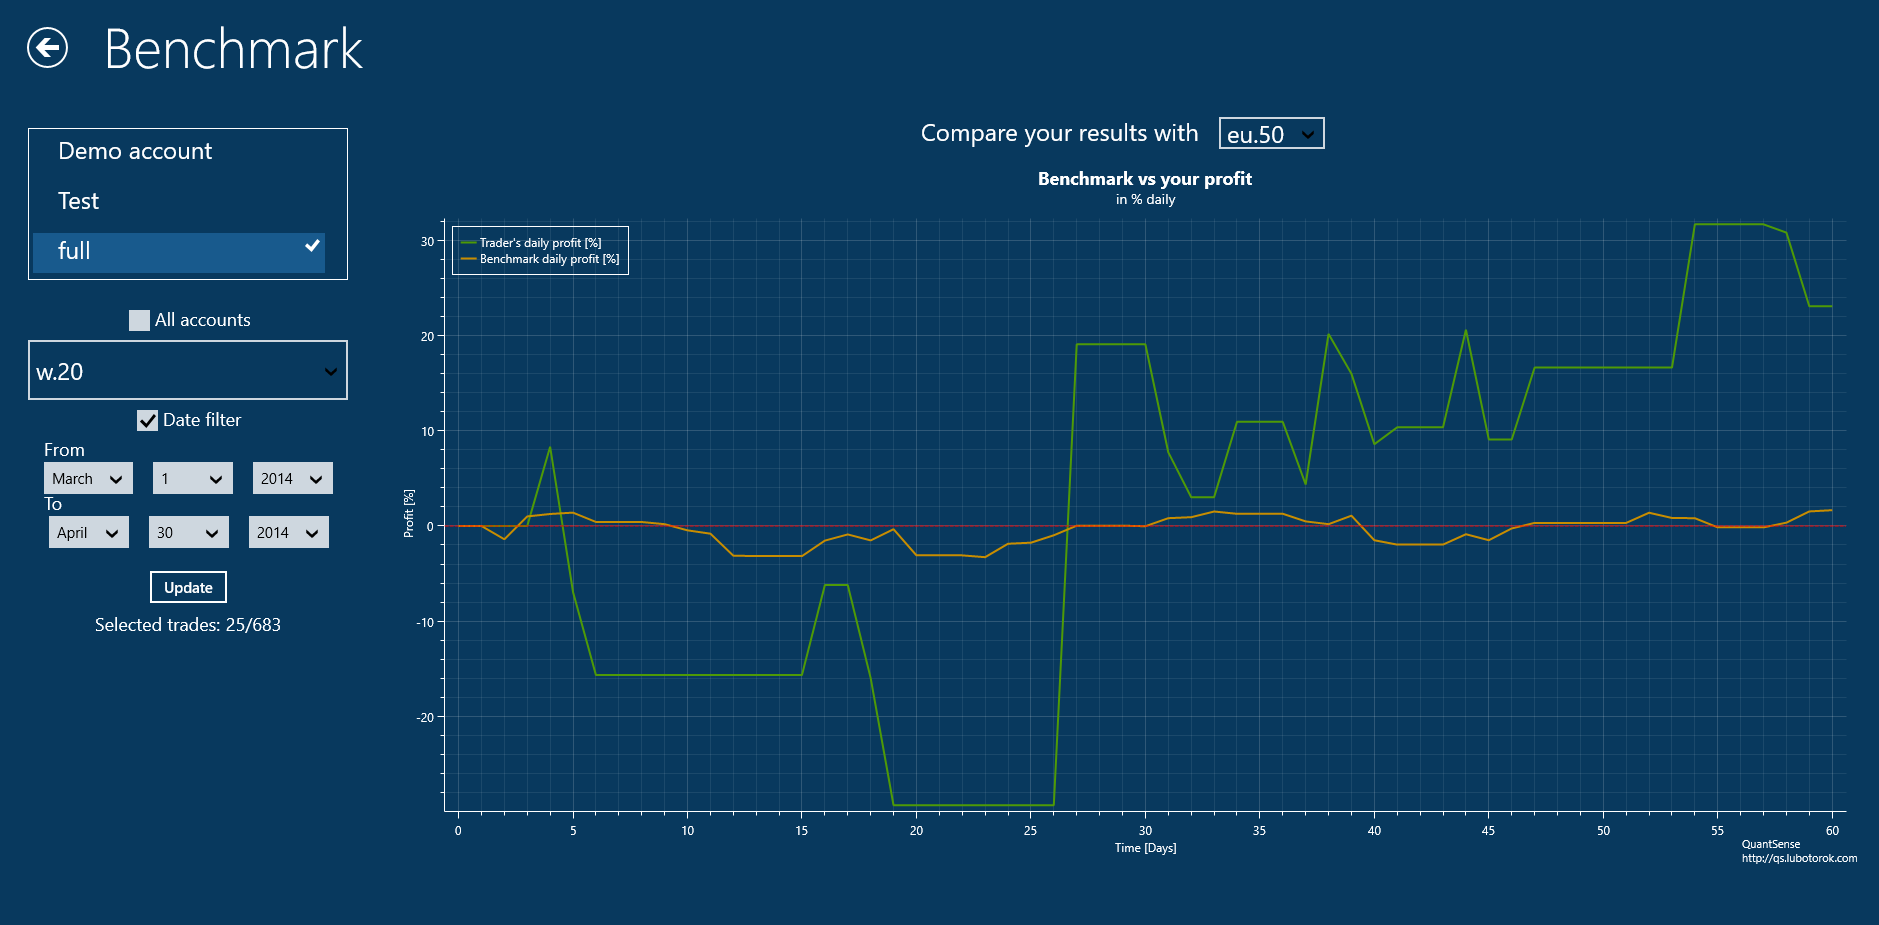
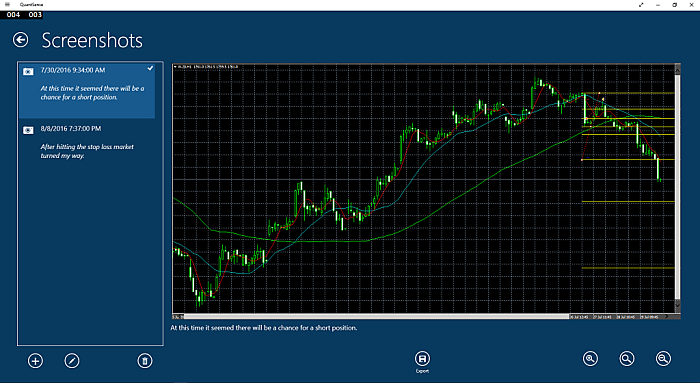
chart screenshots support (since 1.8.1 for Screenshots or Premium upgrades owners)
Make a screenshot of a instrument chart in your trading platform and add it to your trade record in QuantSense. Any number of screenshots can be added to a trade record. Read the upgrade description.